Insights are all in the data
Lay out your data
Organize your numeric or text data in spreadsheets or workbooks. Viewing it in context helps you make more informed decisions.
Reformat and rearrange it
As you look at different configurations, Excel learns and recognizes your pattern and auto-completes the remaining data for you. No formulas or macros required. The Tell Me search feature guides you to the feature commands you need to get the results you are looking for.
Do your analysis
Excel will perform complex analyses for you. And it summarizes your data with previews of pivot-table options, so you can compare them and select the one that tells your story best.

Get a better picture of your data
Flow into charts and graphs
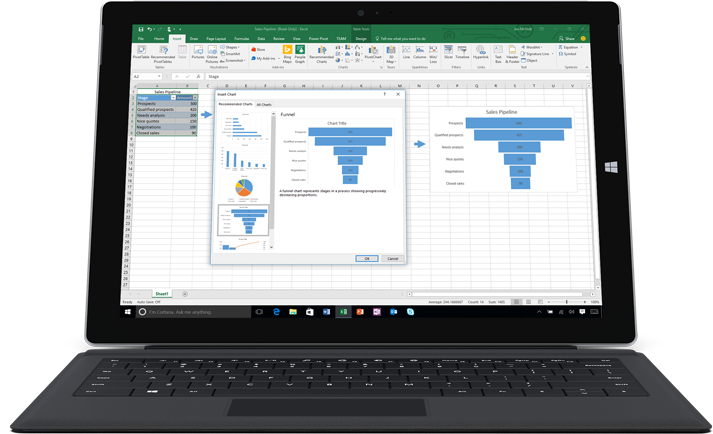
Excel can recommend the charts and graphs that best illustrate your data patterns. Quickly preview your options and pick those that present your insights most clearly.
Find your best storyline
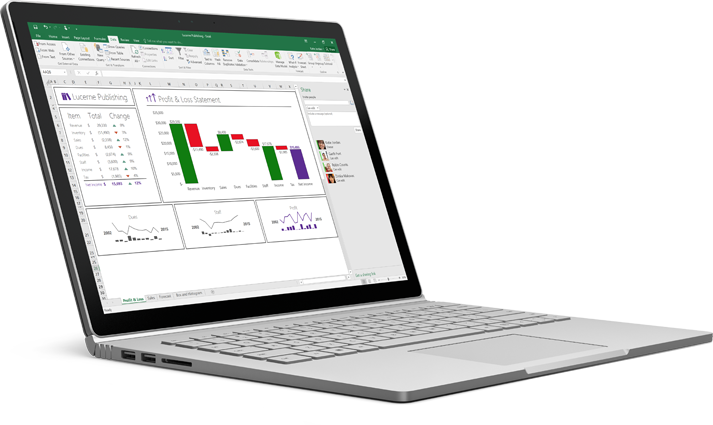
Discover and compare different ways to represent your data and your intents visually. When you see the one that shows your data best, apply formatting, sparklines, charts, and tables with a single click. A set of new modern charts and graphs in Excel 2016 help you to present your data in fresh ways.
Highlight trends and patterns
Make it easy to spot trends and patterns in your data by using bars, colors and icons to visually highlight important values. The new one-click forecasting feature in Excel 2016 creates forecasts on your data series with one click to future trends.
